
INTRODUCTION OF
GRAPH
SPLITTING
(GS) METHOD
A protein superfamily contains distantly related proteins that have acquired diverse biological functions
through long evolutionary history. Phylogenetic analysis of early evolution of such proteins is a key
challenge in evolutionary biology, where existing phylogenetic methods show poor performance when
protein sequences are too diverged to construct an informative multiple sequence alignment.
Graph Splitting (GS) method reliably and efficiently reconstructs a protein superfamily-scale
phylogenetic tree that contains remote homologs (upper panel). In brief, given a set of protein
sequences, GS method first calculates symmetrical relative sequence similarities by all-to-all pairwise
alignments using BLAST and obtains a weighted and undirected sequence similarity graph (SSG),
whose nodes and edges represent the proteins and detected similarities, respectively. Then, the node
set in SSG is recursively split in a top-down manner by the spectral clustering algorithm until a tree
(phylogram) is obtained.
Not only reconstructing trees accurately, any practical phylogenetic method needs to provide reliability
measures on estimated branches, such as bootstrap values and posterior probabilities in the existing
methods. These two measures cannot be easily obtained for a method that does not rely on MSA,
because their calculation requires informative MSA whose columns are independent each other. To
overcome this obstacle, we developed an edge perturbation (EP) method for statistically evaluating
the branch reliability (lower panel). EP method repeatedly makes random perturbations to them.
Subsequently, GS method is run using the perturbed SSGs and the proportion that each phylogenetic
branch is recovered is calculated.
More detailed information can be found in our paper;
Matsui M and Iwasaki W,
Graph Splitting: A Graph-Based Approach for Superfamily-scale Phylogenetic Tree Reconstruction, Systematic Biology, Published online, 2019.
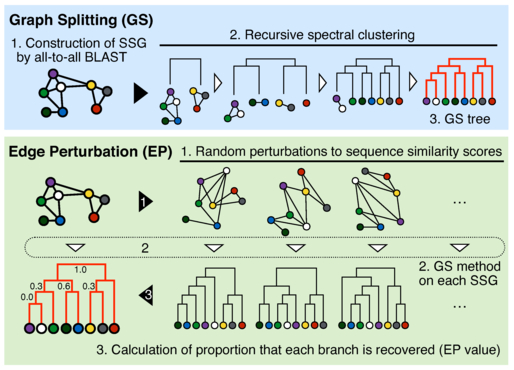
Schematic diagrams of Graph Splitting (GS) and Edge Perturbation (EP) methods.
GS method builds a sequence similarity graph (SSG) in which nodes and edges represent proteins and sequence similarities, respectively. The SSG is then recursively split by the spectral clustering, and its clustering hierarchy gives a phylogenetic tree (cladogram). EP method evaluates reliability of each phylogenetic branch by three steps. First, sequence similarity scores of an SSG are randomly perturbed to produce a large number of SSGs. Second, GS method is run on each tree to reconstruct a phylogenetic tree. Third, a recovery rate of each branch in the original tree is obtained.